

What Happens When You Add Everything to Everything
Strange adventures in arithmetic...
I’ve had this hunch for a while that arithmetic isn’t just a toolbox — it’s a pattern generator. I’ve pestered maths-y friends with this but I’ve found it hard to even articulate what it is I’m trying to say - even that phrase ‘pattern generator’ eluded me. This post has been the result of chatting it over with ChatGPT, which I must thank for helping midwife this idea.
In short, I’m interested in the basic operations: addition, subtraction, multiplication, and division. We usually learn them as mechanical things — press a button, get an answer. But I’ve started wondering: what if these operations naturally give rise to some of the statistical shapes we see in the world?
Like, really: what happens when you multiply everything by everything? Or divide one arbitrary number by another? What if we stopped thinking of these as abstract rules, and started thinking of them as processes that generate distributions?
So, I tested it. With some help from our friend ChatGPT — which, by the way, didn’t just agree with my intuition, it actually plotted the graphs for me — I ran through the four basic operations using huge, unbounded ranges of numbers. Here's what came out. Note that the graphs don’t appear to quite agree with the claims made, but ChatGPT assures me they start to look more like I imagine if we were to stretch them out to infinity.
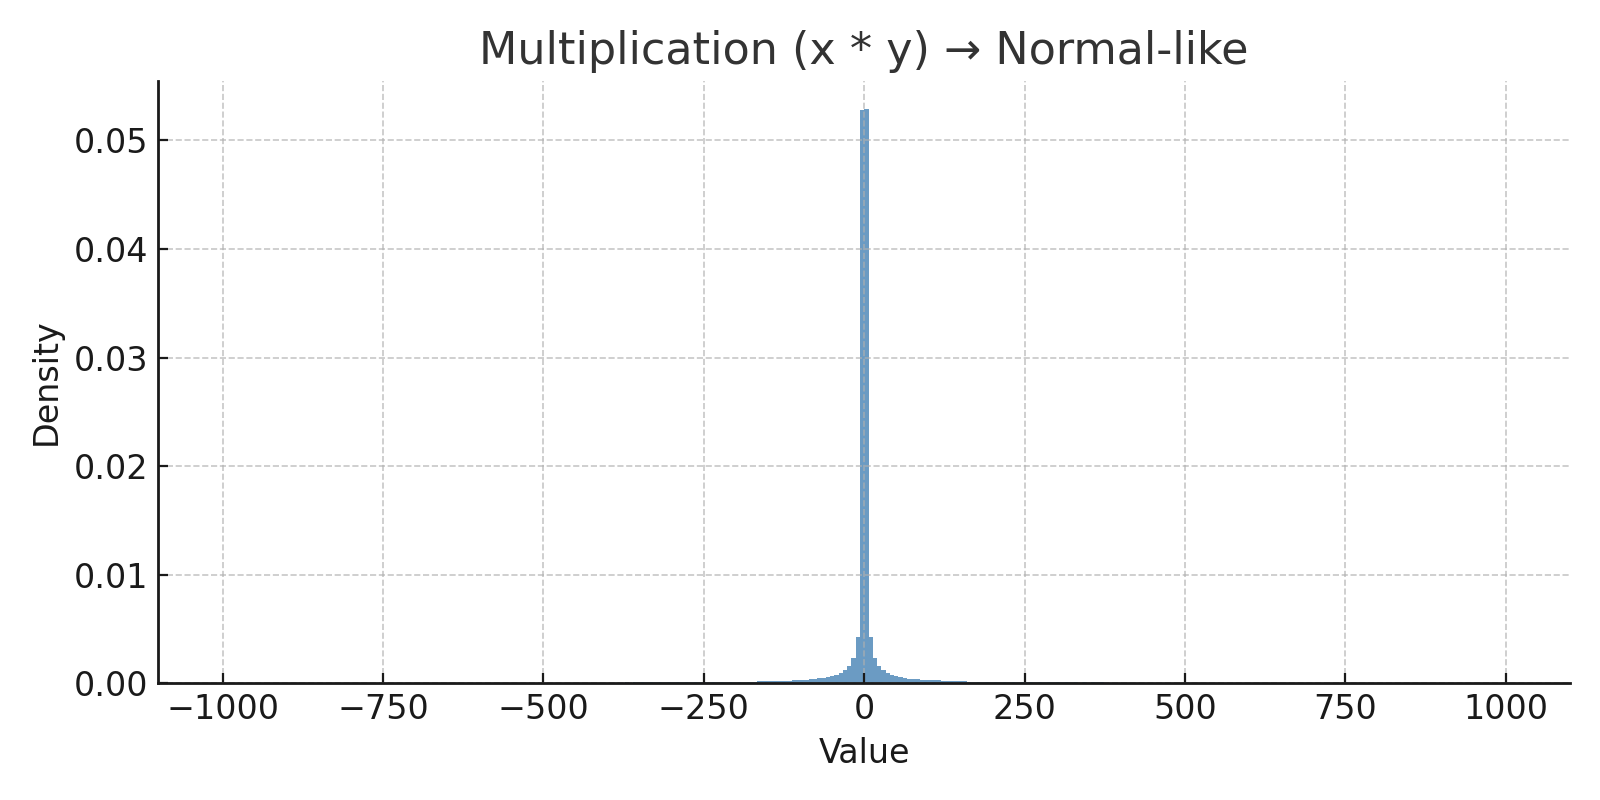
Multiplication → Normal-like
If you multiply two arbitrary real numbers — positive or negative, very small or very large — what you get tends to cluster near zero. That’s because small numbers shrink the result, and big numbers aren’t common enough to outweigh that.
The shape you get is almost a normal distribution. A classic bell curve. It’s symmetric, peaks in the middle, and falls off evenly on either side. The only catch is that the peak is a bit too sharp — but the more you stretch the inputs toward infinity, the more it begins to soften into that familiar bell shape. The curve relaxes as the universe widens.
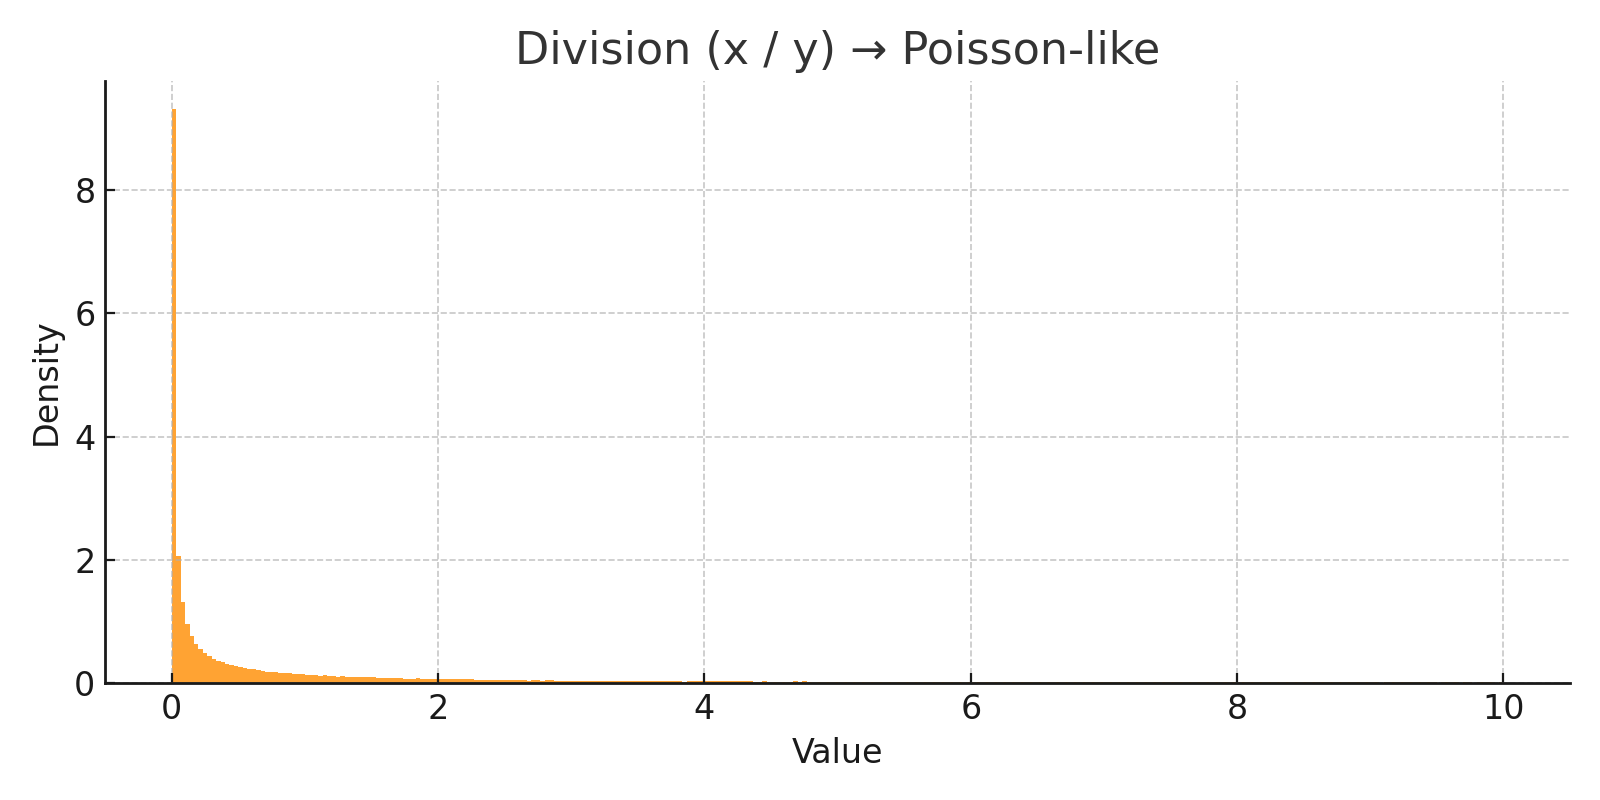
Division → Poisson-like
Division behaves differently. When you divide one arbitrary number by another — assuming they both have an equal chance of being above or below 1 — the results pile up around 1. There’s a strong central peak, then a steep drop-off.
That’s the exact shape of a Poisson distribution. The kind you get when counting rare things, like bus arrivals or phone calls or radioactive decay. It's not literally a Poisson in the technical sense (because we’re dealing with continuous values), but the shape is unmistakable.
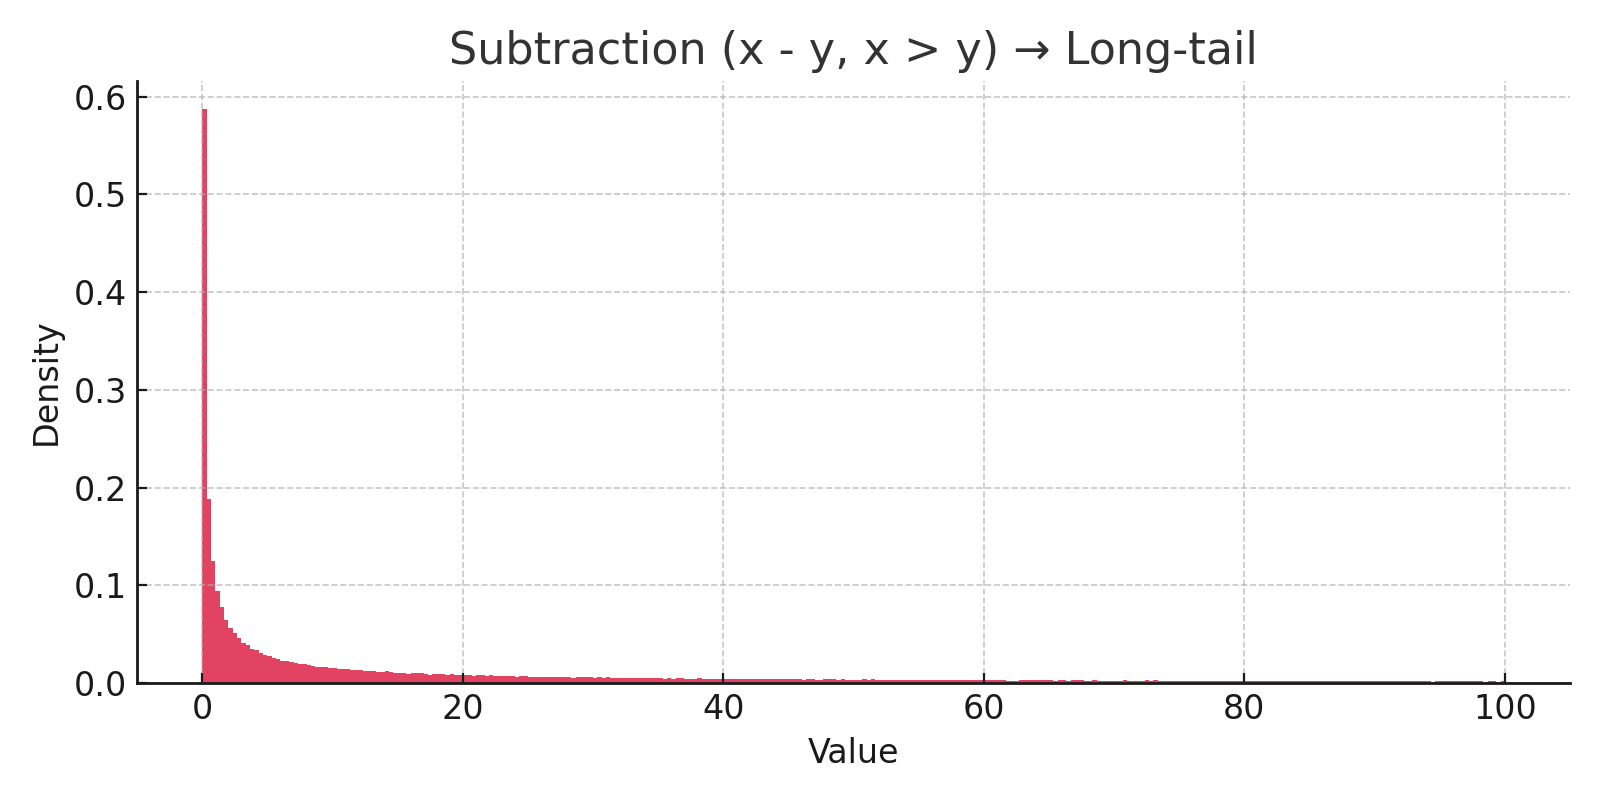
Subtraction → Long-tail (when zero is the floor)
Now, subtraction gets interesting.
Imagine you subtract one arbitrary number from another, but only keep the result if it’s positive. In a lot of real-life situations, zero is the lowest you can go — you can’t have less than zero dollars in your pocket, or negative people in a room. So this filter — only count the result if there’s something “left over” — feels natural.
And the result? You get a classic long-tail distribution. Most values are small differences — one number slightly larger than the other — but every now and then, you get a big outlier. A gap that stretches way out. This is the shape we see everywhere: wealth distributions, viral hits, city populations. Subtraction, viewed this way, naturally creates inequality.
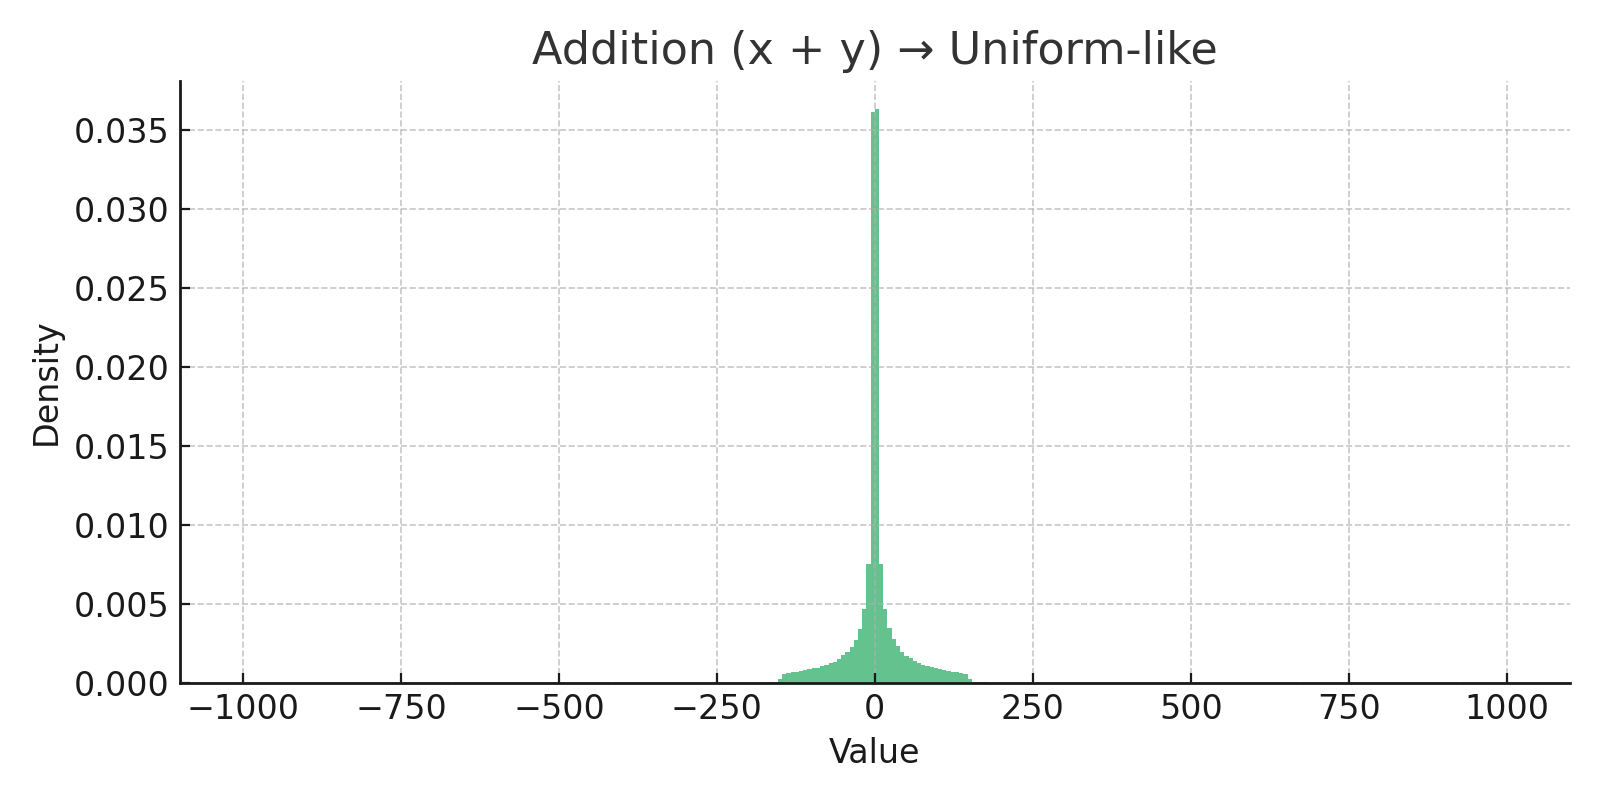
Addition → Uniform-like
Finally, I got to addition.
At first it seemed like the most boring operation. But when you let both inputs range freely — large and small, positive and negative — something elegant happens.
The results spread evenly. There’s no centre of gravity, no particular value that appears more than others. Everything becomes equally likely. The shape is broad and flat — a kind of statistical neutrality.
In other words, addition gives you a uniform distribution. It doesn’t pull things together, it spreads them out.
So here’s the strange little picture that’s emerged:
Multiply everything by everything, and you get a bell curve.
Divide everything by everything, and you get a Poisson spike.
Subtract everything from everything, but only count what’s left, and you get a long tail.
Add everything to everything, and you get a uniform spread.
These aren’t just symbolic operations anymore. They start to look like distribution engines — simple rules that generate the very patterns we use to describe the world.
I’m not claiming this is a new theory of everything. But it’s been fun to think that maybe the shapes we see in statistics aren’t just mathematical conveniences — they’re what happens when arithmetic gets loose in the universe.
A wonderful exploration, and a different perspective on our conception of patterns in mathematics and beyond.